| Home | Q #1 | Q #2 | Q #3 |
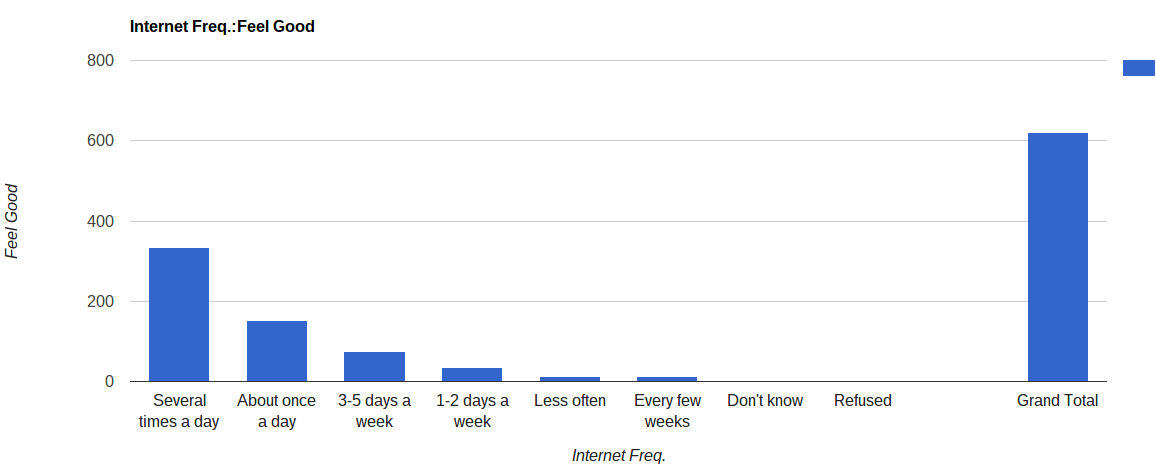
The chart above shows how good people feel based on how much they use the internet.
Research Question
Welcome to research question #1. This question constists of "Does the amount of time you spend on social media reflect how you feel about yourself?"
Answer to Research Question
By using the chart we can see that people who use the internet more frequently are the happiest. People who use the internet the least are the most unhappy. So if the internet were to go out, most peoples happiness level would drop. Ultimately happiness increases the more someone uses the internet.